While a binary approach is one of the more desirable ways to evaluate antibody specificity, binary models are not always readily available and can be time consuming or expensive to produce for the sole purpose of validating an antibody. Moreover, to assess the sensitivity of an antibody in the application and protocol being used, a complementary hallmark is required.
Ideally suited to this purpose, a ranged strategy includes both endogenous and heterologous models that express high, moderate, and low levels of the target of interest. A ranged approach is critical to understand the optimal working conditions of an antibody; however, its importance to the overall antibody validation process may often be overlooked.
The most important (yet subtle) difference between ranged strategy and binary strategy is that ranged models rely on differences in target expression or modification that are not black and white. Typically, ranged models are more reflective of actual biology, where expression of the target is high or low in one cell line or tissue relative to another, or is modified only slightly by agonist or antagonist treatment. This means that, while ranged testing results are significant, they are not as striking or as easily interpretable as data generated by binary evaluation.
Also included within the ranged strategy hallmark are methods such as siRNA that inhibit gene/protein expression but do not always result in complete ablation. By allowing direct comparison of treated samples to the original material, these techniques add considerable value to antibody validation and are typically easier to establish. As described for binary testing, ranged testing should be coupled to an orthogonal strategy to confirm expression.
The prototypical example of a ranged model is the use of multiple samples with varying degrees of protein expression or signal. Yet while it is possible to correlate experimental data with previously published or predicted analysis, this is not always the case, illustrating the need to evaluate an antibody with several approaches to build confidence in specificity and sensitivity.
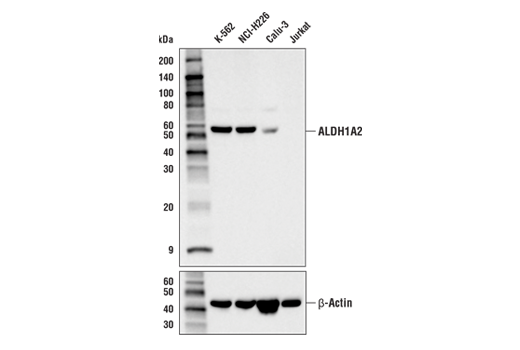
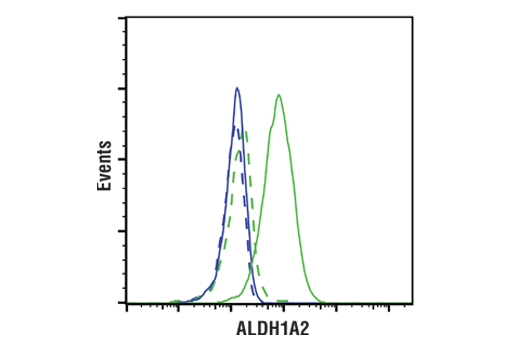
Figures 1 and 2 provide examples of ranged strategy using multiple samples. In Figure 1, Western blot data have been generated using the ALDH1A2 (E6O6Q) rabbit mAb to probe lysates from various cell lines, indicating high expression of ALDH1A2 in K-562 cells relative to expression in Jurkat. Figure 2 shows flow cytometric analysis of K-562 and Jurkat cells using the same ALDH1A2 (E6O6Q) antibody. As shown, the flow cytometry and western blot data support each other, with loading controls ensuring that sample (analyte) quality does not lead to misinterpretation of results. Critically, the observed expression of ALDH1A2 is consistent with publicly available bioinformatic databases, which demonstrates the orthogonal strategy (see page 12).
In cases where endogenous expression may be unsuitable, a direct comparison of treated and untreated samples is useful to evaluate antibody specificity. This highlights the importance of understanding the biological role of a target such that the appropriate model(s) can be employed.
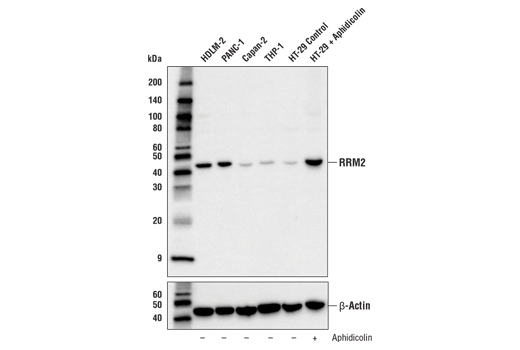
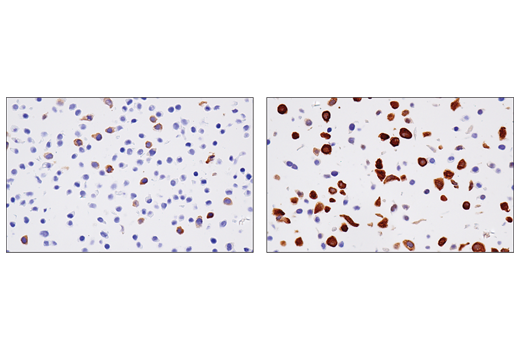
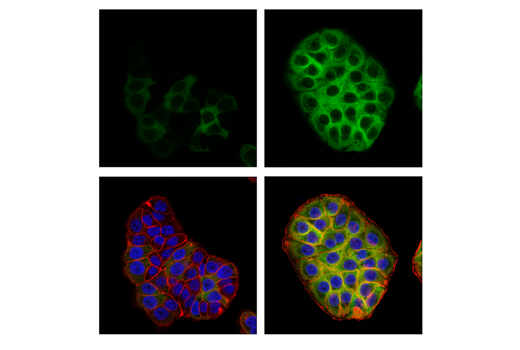
Figures 3, 4, and 5 show data generated using the RRM2 (E7Y9J) rabbit mAb to probe untreated HT-29 cells and HT-29 cells treated with aphidicolin to induce RRM2 expression. It can be seen by western blot, immunohistochemical, and immunocytochemical analysis that RRM2 expression is not binary, but instead transitions from low to high following aphidicolin treatment. Testing the model in each application in which the antibody is intended to be used provides assurance of antibody specificity in that application.
Although the data shown in Figures 1-5 clearly illustrate differences in target expression across various samples or following a carefully chosen treatment, in none of these cases is the signal completely abrogated. To verify specificity and validate experimental findings, it is therefore sensible to employ multiple models. Results obtained using these models should be consistent with published biological or orthogonal data and supported by the findings obtained in other applications or techniques.
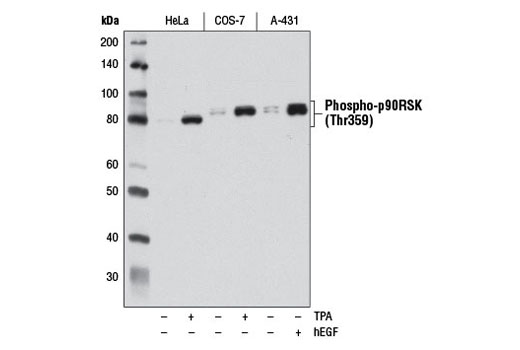
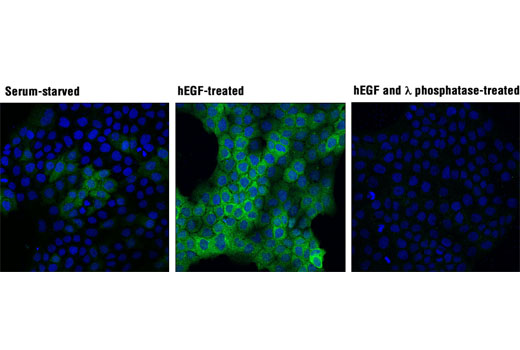
Figures 6 and 7 illustrate the use of multiple models and treatments to validate a phospho-p90RSK (Thr359) rabbit mAb via methods that are consistent with the known biological mechanism of the target. Figure 6 shows western blot analysis of lysates prepared from HeLa, COS-7, and A-431 cells following serum starvation and treatment with 12-O-Tetradecanoylphorbol-13-acetate (TPA) or human epidermal growth factor (hEGF), clearly indicating increased target expression under defined conditions. In Figure 7, the same antibody has been used to perform immunocytochemical analysis of A-431 cells after treatment with hEGF. The same models are used in both applications, with results of independent assays supportive of each other.
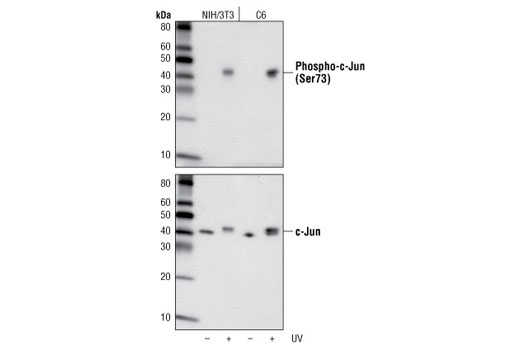
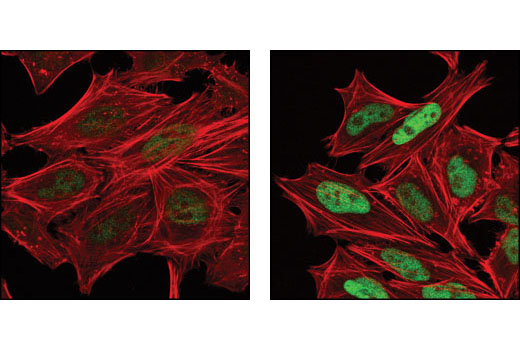
It is important to note that the sensitivity of an antibody can vary significantly from one context and application to the next. This means that validation that may appear binary in one application is instead ranged in another, as illustrated in Figures 8 and 9. Figure 8 shows western blot analysis of phospho-c-Jun (Ser73) expression in lysates prepared from NIH/3T3 and C6 cells following exposure to UV light. In these cell lines and this application, the resulting data appear binary with a signal only detectable in the treated samples. In Figure 9, the same antibody has been used for immunocytochemical analysis of HeLa cells after treatment with anisomycin. Here, the signal appears weak but detectable in the untreated cells.
It is vital to note that, although the phospho-c-Jun signal is absent in the untreated lanes of the western blot, this does not mean that the target itself is absent. Instead, the signal may simply be below the threshold of detection in the western blot application. Additionally, while a weak signal is detectable by immunocytochemical analysis of the untreated cell population, this may indicate greater sensitivity in this application or it may reflect nonspecific binding. For these reasons, multiple approaches should always be used to support the observations obtained in a single experiment.